Introduction to Candlesticks
Japanese candlesticks are a popular charting technique used by traders to analyze price movements. Each candlestick provides a visual representation of the open, high, low, and close (OHLC) prices for a specific time period (e.g., 1 minute, 1 hour, 1 day).
Understanding candlestick anatomy and common patterns can provide valuable insights into market sentiment and potential future price direction.
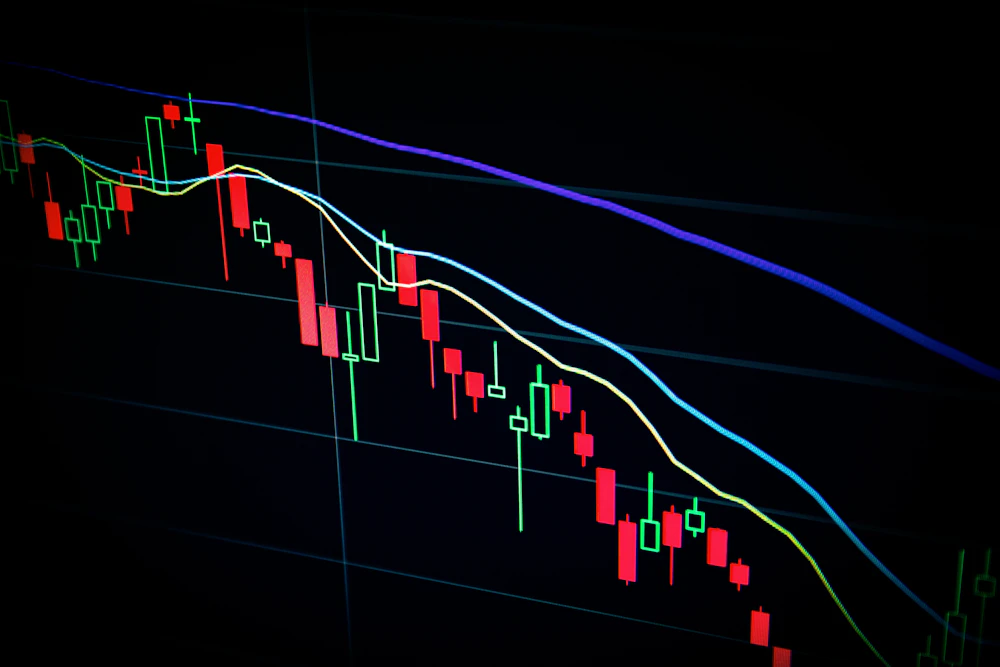
A typical candlestick chart showing price action.
Anatomy of a Candlestick
A candlestick consists of:
- The Body: The rectangular part of the candlestick, representing the range between the open and close price.
- If the close is above the open, the body is typically green or white (bullish).
- If the close is below the open, the body is typically red or black (bearish).
- The Wicks (Shadows): The thin lines extending above and below the body.
- The upper wick shows the highest price reached during the period.
- The lower wick shows the lowest price reached during the period.
The length of the body and wicks, as well as their relation to each other, form various patterns.
Illustrative diagram of bullish and bearish candlestick anatomy.
Common Bullish Candlestick Patterns
Bullish patterns suggest that the price is likely to rise.
1. Hammer
A Hammer is a bullish reversal pattern that forms during a downtrend. It has a small body, a long lower wick (at least twice the size of the body), and little to no upper wick. It indicates that sellers pushed the price down, but buyers came in strong to close the price near the open.
2. Bullish Engulfing
This pattern occurs when a small bearish candle is followed by a larger bullish candle whose body completely engulfs the body of the previous bearish candle. It signals a strong shift in momentum from sellers to buyers.
3. Morning Star
A three-candle bullish reversal pattern:
- A long bearish candle.
- A small-bodied candle (Doji or Spinning Top) that gaps below the previous close.
- A long bullish candle that closes well into the body of the first bearish candle.
Common Bearish Candlestick Patterns
Bearish patterns suggest that the price is likely to fall.
1. Shooting Star
A Shooting Star is a bearish reversal pattern that forms during an uptrend. It has a small body, a long upper wick (at least twice the size of the body), and little to no lower wick. It indicates that buyers pushed the price up, but sellers came in strong to close the price near the open.
2. Bearish Engulfing
This pattern occurs when a small bullish candle is followed by a larger bearish candle whose body completely engulfs the body of the previous bullish candle. It signals a strong shift in momentum from buyers to sellers.
3. Evening Star
A three-candle bearish reversal pattern:
- A long bullish candle.
- A small-bodied candle (Doji or Spinning Top) that gaps above the previous close.
- A long bearish candle that closes well into the body of the first bullish candle.
Key Takeaways: Candlesticks
- Candlesticks show Open, High, Low, Close prices for a period.
- The body and wicks form patterns that indicate market sentiment.
- Bullish patterns (Hammer, Bullish Engulfing, Morning Star) suggest potential price increases.
- Bearish patterns (Shooting Star, Bearish Engulfing, Evening Star) suggest potential price decreases.
- Always use candlestick patterns in conjunction with other forms of analysis and consider the market context.